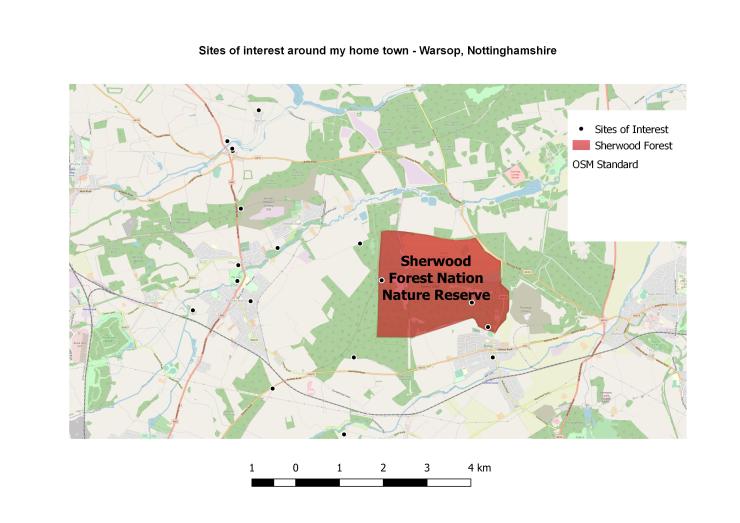
This is a map as an example to show how Geographic Information Systems (GIS) can be used to create maps. As an example, I have created a map showing sites of interest with 5km of my house in Warsop, Nottinghamshire.
GIS systems allows data to be overlaid, points to be plotted and distance to be measure using the national and international co-ordinate systems, such as longitude and latitude as an international measurement and the ordnance survey national grid as an English measurement.
This is based of the Ordance Survey National Grid in SK57.
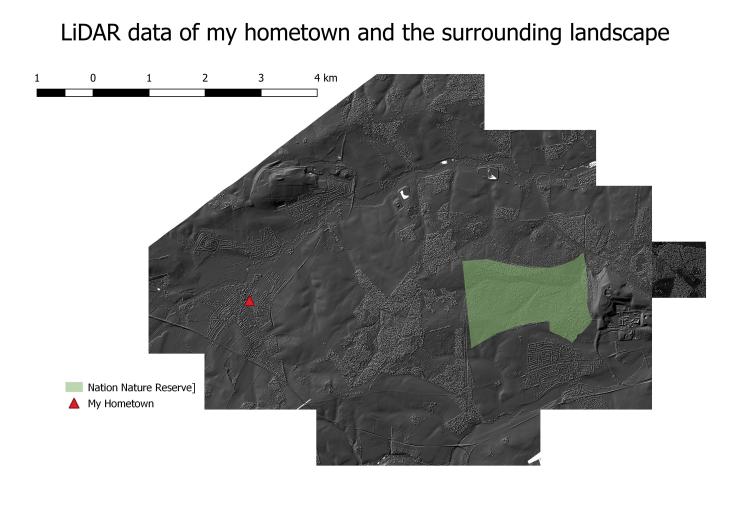
Mapping software such as GIS can be used to overlay these maps and combine them with other forms of non evasive archaeology such as LiDAR, topographic surveys and geo-physics to help understand the landscape further. They can also be used as above to plot sites of interest or finds across a site to show distribution. This sort of GIS system creates data that is easy to understand and interpret for members of the public and academic alike. As an example, this is LiDAR data from the landscape around my hometown, whilst the data itself is difficult to understand, it is presented in a way that is understandable and it shows the relationship between the town (the red triangle) and the national nature reserve (the green area).